I have been keeping track of my daily PnL for the day and for each ticker and my charts for my own personal use in an excel sheet since September. Just recently, near the end of February, I started keeping track of EACH TRADE more specifically as you have seen on the blog with the entries and exits, number of shares, and amount gained or lost, and the percent gained or lost on the trade. When I first started keeping track of my trades like this, I was going to specify what the "type of trade" it was, with things such as "parabolic short (green chart)", "lower highs (green chart)", "washout long (red chart)", etc. but I decided not to specify that much as it was too complicated to differentiate between them and too difficult to find a reasonably easy way to sort through them on the excel sheet. Next month, I may track whether it's a stock that's up on the day (green) or down on the day (red), because I think I'm much better at trading green stocks, and it would be interesting to see if I even make money overall on stocks that are down on the day.
I think that keeping track of a journal is a very key part to one's success as a trader. One needs to be able to figure out what they are doing well and what they are doing poorly, and build on their strengths and cut out or avoid their weaknesses. One could say that you need to build up your weaknesses, but trading is all about "finding your niche", keep focusing on what's working and try to do less and less of what doesn't. Everyone is different, just because someone else can make a lot of money doing "such and such", doesn't mean that you can.
I am still in the process of "finding my niche", my thoroughness of this monthly trading recap should help me see what has been working and what hasn't been, so that I can keep focusing on my strengths and avoiding my weakness in the coming months. My only method of "sorting" for this month is by long and short, and by different price ranges of stocks.
The total for the entire month is $13,570, with $1204 in comissions (after ECN rebates), making the net total $12,365.
Feel free to "skim through" as much as you would like on this, there is quite a bit of text and some of it is just repeated from previous posts.
Here is a look at the PnL for each day of the month:
| Week 1 | Week 2 | ||||
| March 2 | $286.50 | March 09 | $1,158.04 | ||
| March 3 | -$66.40 | March 10 | $382.97 | ||
| March 4 | $2,010.53 | March 11 | $1,899.34 | ||
| March 5 | -$107.52 | March 12 | $1,503.05 | ||
| March 6 | $662.90 | March 13 | -$1,273.60 | ||
| Total | $2,786.01 | Total | $3,669.80 | ||
| Week 3 | Week 4 | ||||
| March 16 | $1,189.28 | March 23 | $1,263.50 | ||
| March 17 | $1,064.24 | March 24 | $3,056.26 | ||
| March 18 | -$641.89 | March 25 | -$184.67 | ||
| March 19 | -$232.08 | March 26 | $1,952.82 | ||
| March 20 | $1,220.00 | March 27 | -$1,676.71 | ||
| Total | $2,599.55 | Total | $4,411.20 | ||
| Week 5 | |||||
| March 30 | $259.36 | ||||
| March 31 | -$268.51 | ||||
| Total | -$9.15 |
I had a total of 14 green days and 8 red days, with the average green day being $1279.20 and the average red day being $597.55. (average red days should have been less than that but my two bad losing days on those Fridays after an amazing week brought it down a lot)
Because of the way I trade, often averaging into losers, I have a fairly high "win rate" but my losses are often a lot bigger than my gains, the averages get skewed from a few really big losses.
FOR NEW READERS ONLY: If I am scaling in and out of a position, that is considered one trade until I am completely out of the position and then it becomes a new trade, that's why some trades have a lot of shares, even if I never had that much at once, if I cover half and then re-add my cover, it's still considered one trade until I am completely out. The entry is the average of the entries and the exit is the average of all the exits. The entries/exits are rounded to 2 decimal places, but the exact number is calculated for the PnL, so that's why the dollar amount may look different than what you see. (it may be 7.165 instead of 7.17, etc). Also, you can click on the charts if you want to make them bigger to be able to better see the entries/exits.
Here is a look at all of my shorts with the total PnL being $11,978.54 from 111 total trades with 96 "wins" and 15 losses (86.5%) with an average gain is $240.84 and the average loss is $742.79:
| Date | Symbol | Type | Entry | Exit | Shares | +/- $Amt | $ PnL | % Pnl |
| 2-Mar-15 | UNXL | Short | 7.18 | 7.09 | 450 | $0.09 | $40.50 | 1.25% |
| 2-Mar-15 | ATHX | Short | 3.27 | 3.04 | 2000 | $0.23 | $450.00 | 6.89% |
| 2-Mar-15 | WBAI | Short | 9.34 | 9.67 | 2000 | -$0.32 | -$650.00 | -3.48% |
| 2-Mar-15 | OHRP | Short | 10.35 | 10.29 | 2700 | $0.06 | $163.27 | 0.58% |
| 2-Mar-15 | OHRP | Short | 10.39 | 10.31 | 1800 | $0.08 | $149.00 | 0.80% |
| 2-Mar-15 | OHRP | Short | 10.37 | 10.16 | 500 | $0.21 | $105.00 | 2.03% |
| 3-Mar-15 | OREX | Short | 7.17 | 7.06 | 2000 | $0.11 | $210.00 | 1.47% |
| 3-Mar-15 | OREX | Short | 7.68 | 8.59 | 3000 | -$0.91 | -$2,729.90 | -11.85% |
| 3-Mar-15 | OREX | Short | 9.07 | 8.60 | 900 | $0.47 | $423.00 | 5.18% |
| 3-Mar-15 | OREX | Short | 9.15 | 8.73 | 1000 | $0.42 | $420.00 | 4.59% |
| 3-Mar-15 | OREX | Short | 8.74 | 8.46 | 1000 | $0.28 | $280.00 | 3.20% |
| 3-Mar-15 | OREX | Short | 8.37 | 8.17 | 1000 | $0.20 | $200.00 | 2.39% |
| 3-Mar-15 | OREX | Short | 8.16 | 8.07 | 4000 | $0.08 | $338.00 | 1.04% |
| 4-Mar-15 | OREX | Short | 8.22 | 8.05 | 2000 | $0.16 | $330.00 | 2.01% |
| 4-Mar-15 | OREX | Short | 8.69 | 8.52 | 950 | $0.17 | $161.50 | 1.96% |
| 4-Mar-15 | OREX | Short | 8.94 | 8.85 | 1000 | $0.09 | $92.50 | 1.03% |
| 4-Mar-15 | OREX | Short | 8.68 | 8.41 | 1000 | $0.27 | $270.00 | 3.11% |
| 4-Mar-15 | NVGN | Short | 4.24 | 4.05 | 4571 | $0.19 | $865.59 | 4.47% |
| 5-Mar-15 | CRMD | Short | 7.16 | 7.16 | 7200 | -$0.00 | -$23.02 | -0.07% |
| 5-Mar-15 | GERN | Short | 3.67 | 3.74 | 9000 | -$0.07 | -$670.00 | -2.03% |
| 5-Mar-15 | SKUL | Short | 11.37 | 11.18 | 150 | $0.19 | $28.50 | 1.67% |
| 5-Mar-15 | OREX | Short | 7.10 | 6.92 | 500 | $0.18 | $90.00 | 2.54% |
| 5-Mar-15 | OREX | Short | 7.13 | 7.01 | 1000 | $0.13 | $125.00 | 1.75% |
| 6-Mar-15 | OREX | Short | 7.38 | 7.19 | 1800 | $0.18 | $326.00 | 2.46% |
| 6-Mar-15 | SSH | Short | 4.09 | 3.93 | 1000 | $0.16 | $160.00 | 3.91% |
| 6-Mar-15 | ANTH | Short | 6.31 | 6.26 | 1463 | $0.05 | $77.04 | 0.83% |
| 9-Mar-15 | ACRX | Short | 5.98 | 5.75 | 2700 | $0.23 | $622.00 | 3.85% |
| 9-Mar-15 | CRMD | Short | 8.56 | 8.40 | 2000 | $0.16 | $318.00 | 1.86% |
| 9-Mar-15 | CRMD | Short | 8.87 | 8.91 | 2600 | -$0.04 | -$99.00 | -0.43% |
| 9-Mar-15 | ANTH | Short | 5.35 | 5.27 | 3800 | $0.08 | $287.46 | 1.42% |
| 9-Mar-15 | UNXL | Short | 7.54 | 7.43 | 500 | $0.11 | $55.00 | 1.46% |
| 10-Mar-15 | LL | Short | 30.77 | 30.46 | 1750 | $0.31 | $539.00 | 1.00% |
| 10-Mar-15 | ACAD | Short | 42.53 | 42.42 | 600 | $0.12 | $71.00 | 0.28% |
| 10-Mar-15 | ACAD | Short | 44.39 | 43.91 | 200 | $0.48 | $96.00 | 1.08% |
| 10-Mar-15 | ACAD | Short | 44.88 | 45.46 | 600 | -$0.58 | -$350.00 | -1.30% |
| 10-Mar-15 | ACAD | Short | 45.71 | 45.66 | 500 | $0.05 | $27.00 | 0.12% |
| 11-Mar-15 | MELA | Short | 3.91 | 3.63 | 4078 | $0.28 | $1,141.34 | 7.15% |
| 11-Mar-15 | MELA | Short | 3.63 | 3.44 | 1000 | $0.19 | $190.00 | 5.23% |
| 11-Mar-15 | JDST | Short | 14.69 | 14.47 | 500 | $0.22 | $110.00 | 1.50% |
| 12-Mar-15 | ACAD | Short | 36.38 | 35.62 | 400 | $0.77 | $306.00 | 2.10% |
| 12-Mar-15 | BONT | Short | 6.20 | 6.06 | 1000 | $0.14 | $141.97 | 2.29% |
| 12-Mar-15 | LL | Short | 36.90 | 36.56 | 1500 | $0.34 | $510.00 | 0.92% |
| 12-Mar-15 | LL | Short | 37.23 | 36.90 | 700 | $0.33 | $231.00 | 0.89% |
| 12-Mar-15 | MELA | Short | 3.44 | 3.36 | 4000 | $0.08 | $311.58 | 2.28% |
| 13-Mar-15 | FXCM | Short | 2.73 | 2.66 | 2000 | $0.07 | $150.00 | 2.75% |
| 13-Mar-15 | LL | Short | 34.77 | 34.38 | 300 | $0.39 | $117.90 | 1.13% |
| 13-Mar-15 | AMPE | Short | 8.42 | 8.32 | 5000 | $0.10 | $525.20 | 1.24% |
| 16-Mar-15 | MVIS | Short | 3.37 | 3.33 | 11400 | $0.04 | $422.50 | 1.19% |
| 16-Mar-15 | INO | Short | 8.37 | 8.17 | 1000 | $0.19 | $193.78 | 2.30% |
| 16-Mar-15 | LL | Short | 29.99 | 29.81 | 300 | $0.18 | $54.00 | 0.60% |
| 17-Mar-15 | ARCO | Short | 5.11 | 5.03 | 3657 | $0.08 | $285.10 | 1.50% |
| 17-Mar-15 | ARCO | Short | 4.98 | 4.90 | 2000 | $0.07 | $150.00 | 1.51% |
| 17-Mar-15 | ANTH | Short | 4.78 | 4.78 | 10042 | -$0.00 | -$32.86 | -0.10% |
| 17-Mar-15 | BGC | Short | 17.98 | 17.72 | 2000 | $0.26 | $507.00 | 1.44% |
| 18-Mar-15 | NVGN | Short | 4.78 | 4.30 | 1000 | $0.48 | $480.00 | 10.04% |
| 18-Mar-15 | NVGN | Short | 4.32 | 4.17 | 3061 | $0.16 | $486.71 | 3.66% |
| 18-Mar-15 | SQM | Short | 16.93 | 16.98 | 2257 | -$0.05 | -$115.60 | -0.31% |
| 19-Mar-15 | FOLD | Short | 12.53 | 12.24 | 400 | $0.29 | $116.00 | 2.31% |
| 19-Mar-15 | CNDO | Short | 4.25 | 4.46 | 4400 | -$0.21 | -$940.00 | -4.94% |
| 19-Mar-15 | CNDO | Short | 4.88 | 5.09 | 900 | -$0.21 | -$189.00 | -4.30% |
| 19-Mar-15 | CNDO | Short | 5.33 | 5.08 | 750 | $0.25 | $183.75 | 4.60% |
| 19-Mar-15 | CNDO | Short | 4.96 | 4.72 | 900 | $0.24 | $216.00 | 4.84% |
| 19-Mar-15 | CNDO | Short | 4.45 | 4.29 | 1000 | $0.16 | $160.00 | 3.60% |
| 19-Mar-15 | PRTA | Short | 40.98 | 40.01 | 90 | $0.97 | $87.30 | 2.37% |
| 20-Mar-15 | VBLT | Short | 5.96 | 5.84 | 2400 | $0.12 | $290.00 | 2.01% |
| 20-Mar-15 | VBLT | Short | 5.84 | 5.77 | 500 | $0.07 | $35.00 | 1.20% |
| 20-Mar-15 | VBLT | Short | 6.35 | 6.16 | 2000 | $0.19 | $375.00 | 2.93% |
| 20-Mar-15 | VBLT | Short | 5.83 | 5.68 | 500 | $0.15 | $75.00 | 2.57% |
| 20-Mar-15 | FOLD | Short | 11.74 | 11.70 | 500 | $0.04 | $20.00 | 0.34% |
| 20-Mar-15 | NXTD | Short | 3.96 | 3.83 | 2600 | $0.13 | $345.00 | 3.35% |
| 20-Mar-15 | NXTD | Short | 3.80 | 3.72 | 1000 | $0.08 | $80.00 | 2.11% |
| 23-Mar-15 | CAPN | Short | 7.03 | 6.77 | 1100 | $0.26 | $287.00 | 3.71% |
| 23-Mar-15 | RADA | Short | 2.75 | 2.81 | 2292 | -$0.06 | -$143.60 | -2.28% |
| 23-Mar-15 | RADA | Short | 2.80 | 2.78 | 1000 | $0.02 | $20.00 | 0.71% |
| 23-Mar-15 | RADA | Short | 2.82 | 2.80 | 1000 | $0.02 | $20.00 | 0.71% |
| 23-Mar-15 | RADA | Short | 2.92 | 2.83 | 1000 | $0.09 | $88.52 | 3.03% |
| 23-Mar-15 | RADA | Short | 3.07 | 3.00 | 15412 | $0.07 | $1,020.10 | 2.15% |
| 24-Mar-15 | RADA | Short | 3.07 | 2.91 | 1000 | $0.16 | $160.00 | 5.21% |
| 24-Mar-15 | RADA | Short | 3.04 | 2.86 | 1000 | $0.18 | $180.00 | 5.92% |
| 24-Mar-15 | RADA | Short | 2.89 | 2.83 | 1000 | $0.06 | $60.00 | 2.08% |
| 24-Mar-15 | ORMP | Short | 7.84 | 7.63 | 2600 | $0.21 | $537.00 | 2.64% |
| 24-Mar-15 | ORMP | Short | 7.73 | 7.43 | 1775 | $0.31 | $544.25 | 3.96% |
| 24-Mar-15 | ORMP | Short | 7.16 | 6.92 | 600 | $0.24 | $141.00 | 3.28% |
| 24-Mar-15 | ORMP | Short | 7.15 | 7.01 | 3000 | $0.14 | $413.38 | 1.92% |
| 24-Mar-15 | ORMP | Short | 7.07 | 7.03 | 1000 | $0.04 | $40.00 | 0.57% |
| 24-Mar-15 | ORMP | Short | 7.33 | 7.27 | 5800 | $0.06 | $340.60 | 0.79% |
| 24-Mar-15 | ORMP | Short | 7.54 | 7.50 | 6000 | $0.04 | $266.40 | 0.59% |
| 24-Mar-15 | ORMP | Short | 7.52 | 7.49 | 4000 | $0.02 | $98.37 | 0.33% |
| 25-Mar-15 | KRFT | Short | 84.13 | 86.22 | 800 | -$2.09 | -$1,668.00 | -2.48% |
| 25-Mar-15 | KRFT | Short | 86.53 | 85.56 | 300 | $0.97 | $291.00 | 1.12% |
| 25-Mar-15 | ROVI | Short | 18.72 | 18.46 | 400 | $0.26 | $104.00 | 1.39% |
| 26-Mar-15 | CNAT | Short | 8.43 | 8.15 | 1000 | $0.28 | $280.00 | 3.32% |
| 26-Mar-15 | CNAT | Short | 7.29 | 7.17 | 4000 | $0.12 | $490.00 | 1.68% |
| 26-Mar-15 | CNAT | Short | 7.39 | 7.32 | 2000 | $0.07 | $140.00 | 0.95% |
| 26-Mar-15 | CNAT | Short | 7.32 | 7.23 | 3360 | $0.09 | $296.00 | 1.20% |
| 26-Mar-15 | CNAT | Short | 7.15 | 7.13 | 3000 | $0.03 | $83.82 | 0.38% |
| 26-Mar-15 | ORMP | Short | 6.68 | 6.57 | 1000 | $0.11 | $105.00 | 1.57% |
| 26-Mar-15 | ORMP | Short | 7.35 | 7.14 | 600 | $0.21 | $128.00 | 2.90% |
| 27-Mar-15 | GBSN | Short | 3.35 | 3.14 | 200 | $0.21 | $42.00 | 6.27% |
| 27-Mar-15 | CNAT | Short | 7.48 | 7.43 | 2500 | $0.05 | $124.29 | 0.67% |
| 27-Mar-15 | ALTR | Short | 42.14 | 43.35 | 1700 | -$1.20 | -$2,043.00 | -2.85% |
| 30-Mar-15 | GENE | Short | 4.64 | 4.63 | 20710 | $0.01 | $151.19 | 0.16% |
| 30-Mar-15 | GMAN | Short | 7.26 | 7.27 | 1900 | -$0.01 | -$20.89 | -0.15% |
| 31-Mar-15 | GENE | Short | 5.28 | 5.53 | 6000 | -$0.24 | -$1,467.00 | -4.63% |
| 31-Mar-15 | GENE | Short | 5.61 | 5.53 | 3000 | $0.08 | $240.00 | 1.43% |
| 31-Mar-15 | GENE | Short | 5.34 | 5.30 | 1000 | $0.04 | $40.00 | 0.75% |
| 31-Mar-15 | GENE | Short | 5.41 | 5.33 | 2000 | $0.09 | $170.00 | 1.57% |
| 31-Mar-15 | GBSN | Short | 4.10 | 3.98 | 1600 | $0.13 | $202.00 | 3.08% |
| 31-Mar-15 | CRMD | Short | 9.29 | 9.20 | 1000 | $0.09 | $90.00 | 0.97% |
| 31-Mar-15 | CRMD | Short | 9.39 | 9.17 | 1000 | $0.22 | $220.00 | 2.34% |
| 31-Mar-15 | CRMD | Short | 9.70 | 9.65 | 1900 | $0.05 | $89.00 | 0.48% |
Here is a look at all of my longs with the total PnL being $1,591.18 from 65 total trades with "wins" and 15 losses (76.9%) with an average gain is $123.92 and the average loss is $306.98:
| 2-Mar-15 | LL | Long | 41.30 | 41.15 | 300 | -$0.15 | -$45.00 | -0.36% |
| 2-Mar-15 | EYES | Long | 15.88 | 16.12 | 300 | $0.24 | $72.00 | 1.51% |
| 3-Mar-15 | BIOC | Long | 3.78 | 3.85 | 4000 | $0.06 | $250.00 | 1.65% |
| 3-Mar-15 | OREX | Long | 8.44 | 8.61 | 1500 | $0.16 | $242.50 | 1.91% |
| 3-Mar-15 | OREX | Long | 8.06 | 8.24 | 1000 | $0.18 | $180.00 | 2.23% |
| 3-Mar-15 | OREX | Long | 7.62 | 7.74 | 1000 | $0.12 | $120.00 | 1.57% |
| 4-Mar-15 | OREX | Long | 7.76 | 7.94 | 1000 | $0.18 | $180.00 | 2.32% |
| 4-Mar-15 | RIGL | Long | 3.14 | 3.17 | 3000 | $0.04 | $110.94 | 1.18% |
| 5-Mar-15 | CAPN | Long | 7.51 | 7.65 | 1500 | $0.14 | $210.00 | 1.86% |
| 5-Mar-15 | CAPN | Long | 6.82 | 6.92 | 1000 | $0.11 | $105.00 | 1.54% |
| 5-Mar-15 | EYES | Long | 16.56 | 16.87 | 100 | $0.31 | $31.00 | 1.87% |
| 5-Mar-15 | SKUL | Long | 11.10 | 10.86 | 200 | -$0.24 | -$48.00 | -2.16% |
| 5-Mar-15 | OREX | Long | 6.83 | 6.99 | 100 | $0.16 | $16.00 | 2.34% |
| 5-Mar-15 | OREX | Long | 6.82 | 7.06 | 100 | $0.24 | $24.00 | 3.52% |
| 6-Mar-15 | CRMD | Long | 7.89 | 7.92 | 2000 | $0.03 | $61.86 | 0.39% |
| 6-Mar-15 | EYES | Long | 17.10 | 17.15 | 800 | $0.05 | $38.00 | 0.28% |
| 9-Mar-15 | ANTH | Long | 5.52 | 5.52 | 4000 | -$0.01 | -$25.42 | -0.14% |
| 11-Mar-15 | MELA | Long | 3.48 | 3.51 | 3000 | $0.03 | $90.00 | 0.86% |
| 11-Mar-15 | JDST | Long | 15.51 | 15.68 | 2200 | $0.17 | $369.00 | 1.08% |
| 11-Mar-15 | JDST | Long | 14.79 | 14.74 | 1000 | -$0.04 | -$45.00 | -0.30% |
| 11-Mar-15 | JDST | Long | 13.87 | 13.85 | 2000 | -$0.02 | -$45.00 | -0.16% |
| 11-Mar-15 | CAPN | Long | 6.67 | 6.85 | 500 | $0.18 | $89.00 | 2.67% |
| 12-Mar-15 | CUR | Long | 3.03 | 2.99 | 2500 | -$0.04 | -$97.50 | -1.29% |
| 12-Mar-15 | CUR | Long | 2.37 | 2.47 | 1000 | $0.10 | $100.00 | 4.22% |
| 13-Mar-15 | JDST | Long | 14.56 | 14.70 | 500 | $0.14 | $70.00 | 0.96% |
| 13-Mar-15 | LL | Long | 33.46 | 32.41 | 2300 | -$1.05 | -$2,408.20 | -3.13% |
| 13-Mar-15 | LL | Long | 31.16 | 31.46 | 1000 | $0.30 | $300.00 | 0.96% |
| 13-Mar-15 | LL | Long | 31.45 | 31.40 | 550 | -$0.05 | -$27.56 | -0.16% |
| 16-Mar-15 | MVIS | Long | 2.89 | 2.92 | 500 | $0.03 | $15.00 | 1.04% |
| 16-Mar-15 | AMRN | Long | 3.03 | 3.06 | 6000 | $0.04 | $210.00 | 1.16% |
| 16-Mar-15 | ANTH | Long | 4.29 | 4.27 | 1000 | -$0.02 | -$20.00 | -0.47% |
| 16-Mar-15 | ANTH | Long | 4.12 | 4.16 | 7300 | $0.04 | $324.00 | 1.03% |
| 16-Mar-15 | ANTH | Long | 3.91 | 3.90 | 1000 | -$0.01 | -$10.00 | -0.26% |
| 17-Mar-15 | AMRN | Long | 2.62 | 2.70 | 1000 | $0.08 | $80.00 | 3.05% |
| 17-Mar-15 | JDST | Long | 14.13 | 14.28 | 500 | $0.15 | $75.00 | 1.06% |
| 18-Mar-15 | NVGN | Long | 4.21 | 4.24 | 2800 | $0.03 | $90.00 | 0.76% |
| 18-Mar-15 | MTSN | Long | 3.92 | 4.00 | 1000 | $0.08 | $80.00 | 2.04% |
| 18-Mar-15 | SQM | Long | 16.23 | 16.06 | 2200 | -$0.18 | -$385.00 | -1.08% |
| 18-Mar-15 | UVXY | Long | 16.62 | 15.91 | 1800 | -$0.71 | -$1,278.00 | -4.28% |
| 18-Mar-15 | FOLD | Long | 11.86 | 11.98 | 500 | $0.12 | $60.00 | 1.01% |
| 18-Mar-15 | FOLD | Long | 12.87 | 12.99 | 500 | $0.12 | $60.00 | 0.93% |
| 18-Mar-15 | CNDO | Long | 4.37 | 4.43 | 1000 | $0.06 | $64.00 | 1.46% |
| 18-Mar-15 | CNDO | Long | 4.78 | 4.94 | 304 | $0.16 | $48.64 | 3.35% |
| 18-Mar-15 | CNDO | Long | 4.73 | 4.68 | 1000 | -$0.05 | -$50.00 | -1.06% |
| 18-Mar-15 | CNDO | Long | 4.44 | 4.50 | 1000 | $0.06 | $60.00 | 1.35% |
| 18-Mar-15 | CNDO | Long | 4.45 | 4.34 | 1000 | -$0.11 | -$110.00 | -2.47% |
| 23-Mar-15 | IMGN | Long | 8.84 | 8.94 | 1000 | $0.10 | $100.00 | 1.13% |
| 24-Mar-15 | RADA | Long | 3.01 | 3.07 | 900 | $0.06 | $54.00 | 1.99% |
| 24-Mar-15 | FNJN | Long | 2.47 | 2.54 | 3000 | $0.07 | $221.03 | 2.99% |
| 25-Mar-15 | LL | Long | 29.21 | 29.57 | 1500 | $0.36 | $533.75 | 1.22% |
| 25-Mar-15 | KRFT | Long | 85.18 | 85.34 | 500 | $0.15 | $76.50 | 0.18% |
| 25-Mar-15 | VBLT | Long | 7.22 | 7.25 | 10000 | $0.04 | $367.08 | 0.51% |
| 25-Mar-15 | ROVI | Long | 18.32 | 18.69 | 300 | $0.37 | $111.00 | 2.02% |
| 26-Mar-15 | CNAT | Long | 7.88 | 7.98 | 2000 | $0.10 | $200.00 | 1.27% |
| 26-Mar-15 | CNAT | Long | 7.47 | 7.51 | 1000 | $0.04 | $40.00 | 0.54% |
| 26-Mar-15 | CNAT | Long | 6.86 | 6.98 | 1000 | $0.12 | $120.00 | 1.75% |
| 26-Mar-15 | CNAT | Long | 6.66 | 6.73 | 1000 | $0.07 | $70.00 | 1.05% |
| 27-Mar-15 | GBSN | Long | 2.84 | 2.84 | 500 | $0.00 | $0.00 | 0.00% |
| 27-Mar-15 | OHRP | Long | 2.91 | 3.00 | 1000 | $0.09 | $90.00 | 3.09% |
| 27-Mar-15 | VBLT | Long | 6.06 | 6.17 | 1000 | $0.11 | $110.00 | 1.82% |
| 30-Mar-15 | ZIOP | Long | 12.33 | 12.41 | 1390 | $0.08 | $115.40 | 0.67% |
| 30-Mar-15 | ZIOP | Long | 11.96 | 12.10 | 169 | $0.14 | $23.66 | 1.17% |
| 30-Mar-15 | CANF | Long | 3.25 | 3.23 | 500 | -$0.02 | -$10.00 | -0.62% |
| 31-Mar-15 | GENE | Long | 5.48 | 5.57 | 1000 | $0.09 | $90.00 | 1.64% |
| 31-Mar-15 | GENE | Long | 5.38 | 5.39 | 3500 | $0.01 | $47.49 | 0.25% |
Now to specify the PnL from different price ranges of stocks, I have decided to use three different price ranges, $2-10, $10-20, and $20+:
| $2-10 | $10-20 | $20+ | |||||
| Short | $12,522.17 | Short | $1,187.17 | Short | -$2,124.10 | ||
| Long | $3,937.62 | Long | -$775.94 | Long | -$2,104.25 | ||
| Total | $16,459.79 | Total | $411.23 | Total | -$4,228.35 |
As you can see I made $16,459.79 from $2-10 dollar stocks, $411.23 on $10-20 dollar stocks, and LOST $4,228.35 on $20+ dollar stocks. I need to just really focus on what's been working and staying away from what doesn't. Next month, I want try to avoid trading $20+ dollar stocks for the most part, I will only trade them if I think it's a really good opportunity but I will force myself to use MUCH SMALLER SIZE because I am not as good at trading those types of stocks.
Now to take a look at my biggest losses on the month and review the charts and what I did wrong:
Most of them are from forcing trades and using way too much size on higher priced stocks that I'm not as good at, and also stocks with a recent or ongoing news event which I have no control over and do not fully understand. There are lessons for each one that I had already written on those days which are useful, but ideally, I will just AVOID trading those types of stocks ($20+ dollar stocks, and intra-day news related stocks) in the future because I am MORE LIKELY to LOSE trying to trade them as it has been shown from my trades on those types of stocks this month.
The first one is OREX on March 3rd. I t was a very strong stock with positive news and tons of volume. It had a big initial move from 5.90 to 7.30's, and then pulled back to around 7 and was grinding back up towards HOD, I shorted 1000 shares just past previous HOD at 7.42, I must have been thinking maybe we'd get a HOD rejection candle and slam back to 7.20's. But it kept going, so my theory was wrong, and I should have stopped out in the 7.50's for a 10-15 cent loss and moved on, instead I added another 1500 right away and it went straight up to 8, almost covered there but didn't, almost covered 8.30's but didn't, it hit 8.75, then it came back down to 8.20's and I covered almost all. I still had 800 shares left, then I readded 500 more shares 8.52, and covered everything around 9, this not covering and then re-adding, cost me about an additional $800 from what it would have been covering all around 8.30.

| Type | Entry | Exit | Shares | +/- $Amt | $ PnL | % Pnl |
| Short | 7.68 | 8.59 | 3000 | -$0.91 | -$2,729.90 | -11.85% |
- Lessons:
- Do not add, add, add to losing positions into way too much size with no plan
- Never short a strong, up-trending stock, anywhere near previous HOD after it's consolidated and it's grinding back up, don't try to guess a HOD rejection, wait for it to tell you what it's going to do
The next one is a long on LL on March 13th, which happened to be a Friday after a really good week. The LL CNBC interview/conference call, or whatever it was, came on and it went from $33.80's to $34.80's in 2 minutes, I nailed the short into the parabolic but only with 300 shares and covered for 40 cents, then went long just for a scalp, but I didn't have the best entry, then I add, add, added to 1100 shares 33.90's average, put an order in at 34.14 for 600 shares and that filled, I had an order at 34.28 for the rest, and then the internet/connection went out, I tried getting back in as soon as possible but it took around 5 minutes and it was in the 33.60's (down like $100-300 on the rest). I add, add, added again to 1400 shares now, my new average was 33.60, it bounced to 33.72 and I just missed an order at 33.74 and didn't hit the bid/panic out anywhere 33.40-33.60, even though it looked weak. It washed to 32.80's and I was down $1000 unrealized, then it slowly bounced and I tried to sell into the bounce but just missed orders again, I had some orders 33.30's and it topped out again 33.25ish (previous support became resistance) and started rolling back over, retested the 33 level and I should have stopped out of everything for a $600-800 dollar loss. It washed out to 32.47, tried to bounce some but couldn't, I almost stopped out at 32.47 when it was retesting that level, but didn't and it was soon 31.60's (more than $1000 dollar difference had I sold 32.47). Then Suretrader liquidated 400 shares at 31.64, then it bounced to 32.20's, once again my orders were just a bit too high, I tried selling half at 32.16 and got 200 shares filled, then it dropped again, I readded 300 shares at 31.81 and then stopped out on everything at 31.80 when it wasn't bouncing for a total loss of $2400.

| Type | Entry | Exit | Shares | +/- $Amt | $ PnL | % Pnl |
| Long | 33.46 | 32.41 | 2300 | -$1.05 | -$2,408.20 | -3.13% |
- Lessons:
- Be very careful/avoid trading anything with an ongoing outside influence (conference calls, CNBC, etc), I don't actually follow them and I have no idea what's going on and anything can happen
- Cannot add, add, add to that much size (the usual size I would trade on a $30 dollar stock is like 200-600 shares and I was in 1400 at once)
- Cannot be so greedy on exits when in a bad trade, I was trying to turn this bad trade into a 20 cent profit and I missed my exits
- Make sure to exit ALL into a bounce, I've taken big losses in the past on similar charts to this, where I would sell HALF and then RE-ADD lower, and it would just keep fading and fading
- Do not "hold and hope" when long on a downtrending chart that's failing to bounce and still acting "heavy", also previous support (33.30ish) was becoming resistance which was a good sign to get out, it then tanked another $1.50 a share in 10 minutes
Next is UVXY on March 18th with the FOMC meeting (another ongoing outside influence which I have no idea what's going on and can't control). I jumped in randomly (while still in another stock, SQM), I had 800 shares 16.95 average right away and it bounced to 17.02 but just super fast and I was still trying to watch both stocks at the same time and missed it. It soon hit 16.16, I didn't panic there because I knew it would bounce some, but I also had no more room to add because I was still in SQM. It bounced from 16.16 to 16.74 and I sold HALF at 16.73. I exited my SQM position so I had more room to add lower now, and for some reason, I ended up added another 1000 shares 16.34-16.43 which was a terrible spot. Now I had 1400 shares 16.53 average, I had potential exits THREE TIMES at 16.10-16.25, which would have been around a $400-600 dollar loss and would have still been slightly green on the day. I had orders in at 16.33 and it didn't quite get there, and I was too stubborn to take the loss because I didn't want to give back my whole day, and I just HOPED for a bounce, ended up losing an extra $600-700 more than I needed to and gave back MORE than my whole day.

| Type | Entry | Exit | Shares | +/- $Amt | $ PnL | % Pnl |
| Long | 16.62 | 15.91 | 1800 | -$0.71 | -$1,278.00 | -4.28% |
- Lessons:
- Do not emotionally add, add, add to a loser, all in one spot, have to always be thinking of a "max size", and always making "smart adds"
- Be very careful trading anything with an ongoing outside influence (FOMC meeting)
- Never trade UVXY long when SPY is green, even when SPY pulls, UVXY hardly bounces
- Never fight the trend on UVXY/SPY in the last hour
- Do not "hold and hope" on a long on a down-trending chart, washout scalps and higher lows ONLY, do not stay in when it's continuing to make lower highs and then breaks a key support level (15.90ish)
Next is KRFT on March 25th, an $80 dollar "thickly" traded stock with a huge gap up on some positive news. I shorted into some speeding up at 82.85, only 100 shares and it pulled to 82.50 and I almost covered, but the size was so small and meaningless for $35 bucks. Then added another 200 above 83 and had 300 shares 83.09 average, and it pulled to 82.75 but then starting grinding back up holding higher lows. I terribly added another 100 at 83.19 which didn't change my average at all, and then added another 200 83.50ish. This is where I should have been STOPPING OUT, not ADDING. I "unhid" my unrealized PnL, and it was -$250 or so, but I didn't take the loss, a few minutes went by and the unrealized loss started escalating very quickly, I was waiting for a pullback/washout to cover into but it never came until it hit 85.80 (another $2 dollars a share), it pulled from 85.80 to 85, but then held 85 on two attempts ("they" were absorbing a lot at 85 and I should have been covering 85.01 when it wasn't breaking down) and then spiked up again and then continued to hold higher lows, even with the crazy 50+ cent alternating green and red candles. Then begun the "next leg" up to 87.80s, faded back to 86.70 and I missed covering again and it spiked all the way back, but this time it made a LOWER HIGH, and then it started to fade and I covered everything 86.01-86.36 (with one 200 share readd at 86.78) for a total loss of $1668.

| Type | Entry | Exit | Shares | +/- $Amt | $ PnL | % Pnl |
| Short | 84.13 | 86.22 | 800 | -$2.09 | -$1,668.00 | -2.48% |
- Lessons:
- Never short a slowly uptrending "thick" stock, ONLY backside and LOWER HIGHS (even try to avoid parabolic scalps on "thick" stocks, there are lots of "professional traders" and funds involved and they can support it much higher)
- Always make sure to COVER ALL once it starts to grind back up
- DO NOT BE ADDING MORE TO YOUR POSITION WHEN YOU SHOULD BE STOPPING OUT (it pulled back a bit, grinded back up and then spiked to a NHOD again which means I'm WRONG and need to take the loss not be adding to the position)
- Can always TAKE THE LOSS into a dip and then REPLACE those shares higher again if it starts to top out (I almost took the loss many times into dips in the 85's and 86's but would miss it and it would spike back up again quickly)
- Should be covering at least some if the bid is absorbing and it's failing to breakdown a key level (85 was absorbing a lot and I should have been covering)
- The longer you hold onto a stubborn trade, the more OPPORTUNITY you miss
- Once it pulls back and then bounces back up and makes a LOWER HIGH, can short all pops for more fading
Next is ALTR on March 27th, which was a Friday after an amazing week (just like my big loss on LL). After a slow day, there was finally some "action", an intraday news release and volatility halt on ALTR. I thought I would try to scalp some quick money shorting this, but only wanted to trade it small, 100-200 shares. My first two entries were terrible around 40 (100 shares each), I added another 500 in 100 share orders from 40.74-41.29 which brought my total position to 700 shares avg 40.77 (over 2:1 limit and it's past 3:30 EST). Everything happened so fast, but I know I had some orders already in to cover for a small profit at some point, and I was changing the prices of orders right before it pulled to 40.28. I was trying to cover everything quickly there but I was too greedy and too slow, putting an order on the bid in the 40.30's and missing it and it spiked up $2/share in the next candle to 42.30's, and I added another 200 shares on the way up around 41.45 where I should have been "panic covering" for a $400-500 dollar loss. I got bought in on most of my shares at 42.17 for almost a $1000 dollar loss but still had 230 shares left which would have been another $200 dollar loss just covering the rest there. I readded another 300 at 42.39 (even though I knew I was over 2:1 limit) and it pulled back to 42.05. I had orders in 41.50's-41.70's to cover it all on a quick 42 break, but 42.05 bidders held as support and it perked back up again. I had more readds, and more buyin's and some covers (by me) but only covering some not all, and more readds, and eventually fighting this into the very last minute into the 44's and eventually covering my last 300 shares afterhours, adding another $800 dollars in losses from all that, instead of just covering the last 230 shares when I got bought in. A horrible way to ruin an amazing week, from forcing a stupid trade in the last 30 minutes on a Friday after taking it easy the entire day.

| Type | Entry | Exit | Shares | +/- $Amt | $ PnL | % Pnl |
| Short | 42.14 | 43.35 | 1700 | -$1.20 | -$2,043.00 | -2.85% |
- Lessons:
- ALWAYS USE LESS SIZE on these parabolic intraday news release plays and be ESPECIALLY CAREFUL shorting when it's in the last 30 minutes, there isn't much time for it to pullback and shorts get squeezed into the close
- Do not add, add, add into so much size so uncontrollably
- MAKE SURE TO COVER ALL into that first washout/dip, ALWAYS have orders in and if you miss them, you can TAKE THE ASK (I had 50 cents profit on 700 shares for a split second but I missed it and 2 minutes later I was down $2/share)
- COVER ALL when it's holding a key whole number after pulling back (42.05 held and I was waiting for the 42 break and then it kept spiking much much further for the next 15 minutes)
- Do not force stupid trades on Friday's after a great week, make smart trades and less size and take it easy (I have a habit of making stupid trades and taking big losses on Friday's, most of my big losing days the last few months have been on Friday's, especially after a having a really good week)
The last one is GENE which just happened today on March 31st, the last day of the month. I was short biased on the stock, but the gap up wasn't very big and it already hit 4.80 premarket and had bounced all the way back, so I shouldn't have been so short biased. I missed the short into the first spike 5.25ish, and chased it down in weakness at 5.15 not wanting to miss it if it washed out. I knew it was a terrible entry but tried to make it work, my adds were decent (ended up with 5.25 avg 4000 shares) but I was already in big size and I only got 1000 shares filled at 5.18 into the dip. It popped back up to HOD at 5.32 and I added another 2000 shares into that at 5.32 and 5.37. Now I had 5000 shares 5.29 average, it pulled back to 5.31 but then held and then went up to 5.52, pulled back to 5.35 again (only down like $300ish after being down $1000+), and I didn't get any filled and it popped back up to 5.53. Came all the way back to 5.31, missed covering any, and hit 5.27 twice and I missed covering a single share, even though it was now breakeven after being down $1000. It popped up to 5.45, then pulled back down to 5.35 and made a HIGHER LOW and held ABOVE VWAP, I missing covering any there and it went straight up to 5.60 in 5 minutes (a $1500 difference). Missed covering any into dips, 5.50's and 5.60's, then I got bought in on 2100 shares at 5.68 (liquidated by Suretrader because I was in too big and down on the trade). It came down to 5.50ish and I covered everything into that for a total loss of $1467.
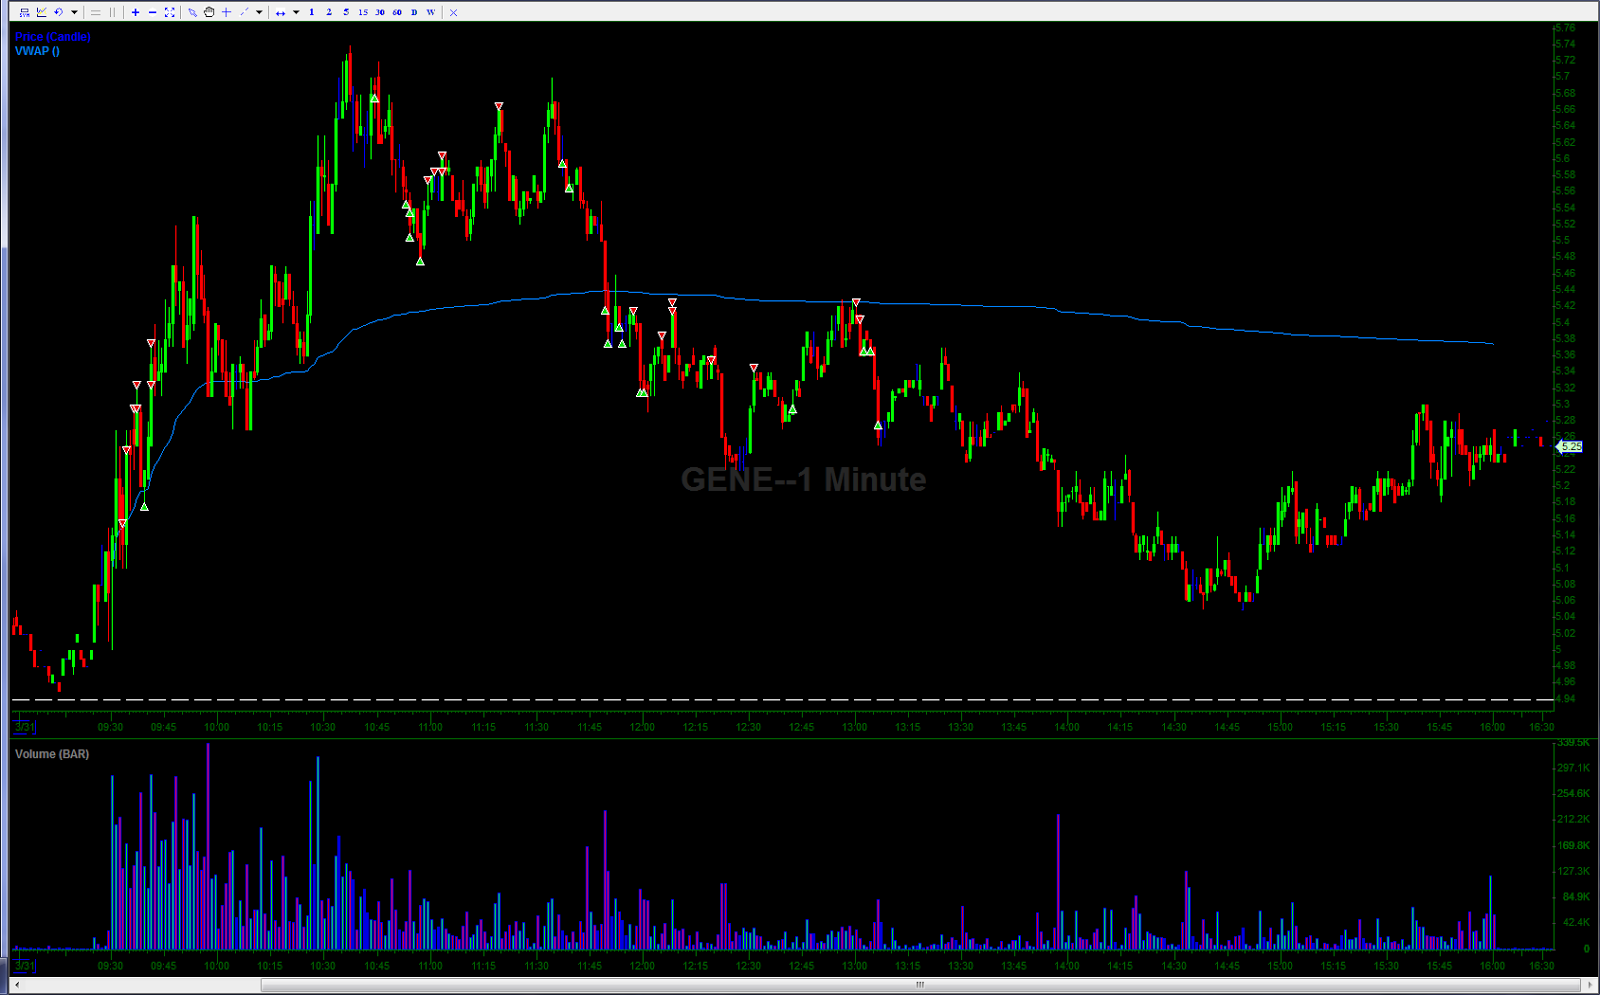
| Type | Entry | Exit | Shares | +/- $Amt | $ PnL | % Pnl |
| Short | 5.28 | 5.53 | 6000 | -$0.24 | -$1,467.00 | -4.63% |
- Lessons:
- Do not chase a bad entry, it's better to miss it than get in at a bad spot (I 100% knew my entry at 5.15 was a bad entry, it held 5.10 and went against me right away and "made me" size in bigger than I would have because I was trying to bring my average up and I didn't cover as much into the dip because my average wasn't as good as it would have been without that first entry)
- When scalping parabolic's and morning emotion in the first 30 minutes, make sure to COVER ALL into dips (make sure to have orders in for ALL around key levels, VWAP was 5.20 and my average wasn't very good and too much size and I only got 1000 shares filled at 5.18)
- Don't be afraid to take the ask when it's starting to bounce
- Whenever you are in a stubborn trade with too much size, have to be SIZING DOWN OR COVERING ALL into dips and then just replacing the shares again higher, even if you think it is going down by the end of the day, if it looks like it's going higher at that moment it's better to cover and then RESHORT AGAIN HIGHER (every 10-20 cents really adds up with that much size)
- Going along with that, if you are in a stubborn trade with too much size and you were just down on it and it comes back to breakeven, have to be COVERING ALL and then looking for better entries later on, don't get too greedy trying to turn it into a profit
Those are the lessons from my biggest losses this month. Most of them were from trading things that I'm not very good at, $20+ dollar stocks or things with intraday news or ongoing outside influences. LL was an ongoing CNBC interview, UVXY was a FOMC meeting, ALTR was a news release and volatility halt 30 minutes before the close, KRFT was trading too big on a thickly traded $80 dollar stock. Stocks that I am good at were OREX and GENE, those big losses were just poorly managed trades with too much size and being too stubborn. I want to avoid trading $20+ dollar stocks and intraday news related stocks next month for the most part, and stick to what works for me, which is $2-10 dollar stocks that are "in play".
Because I often add to losers, I end up having lots of small gains and then a few really big losses. Overall, the way I traded this month still worked out well, I just need to be a lot more controllable with my size and I need to try keep the overall losses from one trade always less than $1000. I had six $1000+ losses this month which equal a total of about $11,500. Without those six losses, my total for the month would have been almost $24,000 instead of $12,365, almost double what I made for the month just by taking out those six trades.
A few of the main things I need to work on:
- Controlling my overall position sizes and being careful not to add, add, add uncontrollably, have to try to make "smart" adds and keeping my overall position size under control
- Making sure to exit the entire position when my thesis for the trade no longer exists (especially if I tried to but got partial fills) and not trying to "make a trade work" with more adds and re-adds in places where I wouldn't normally trade that stock
- Not being too greedy on sells/covers, if I have an order in at a certain spot for a reason, I need to let it fill, and not worry if I goes a bit higher/lower afterwards (there were many times that my trades were screwed up from being too greedy and CHANGING orders higher/lower and missing them)
That is my extensive trading recap for the month of March, 2015. This was my best month of trading of all time, and I think it was honestly my 2nd, 3rd, 4th, and 5th best weeks of all my trading. I had one amazing $5000 week in October, and I've had many $3000-5000 weeks before the week actually ended, only to lose it all, or a lot of it, in ONE TRADE almost always on a Friday.
To repeat the total again, it was $13,570 before commissions and $12,365 after commissions with a total of 14 green days and 8 red days. Without those six $1000+ losses it would have been almost $24,000, so next month I really want to try to keep my biggest losing trades ALWAYS LESS THAN $1000, and also avoiding $20+ stocks for the most part, considering I lost $4,228 trading them, which would have been $16,593 for the month had I just stayed away from them.
Thank you for reading, hope you learned something from my extensive trading recap for March, 2015.